Reports
Owner Reports
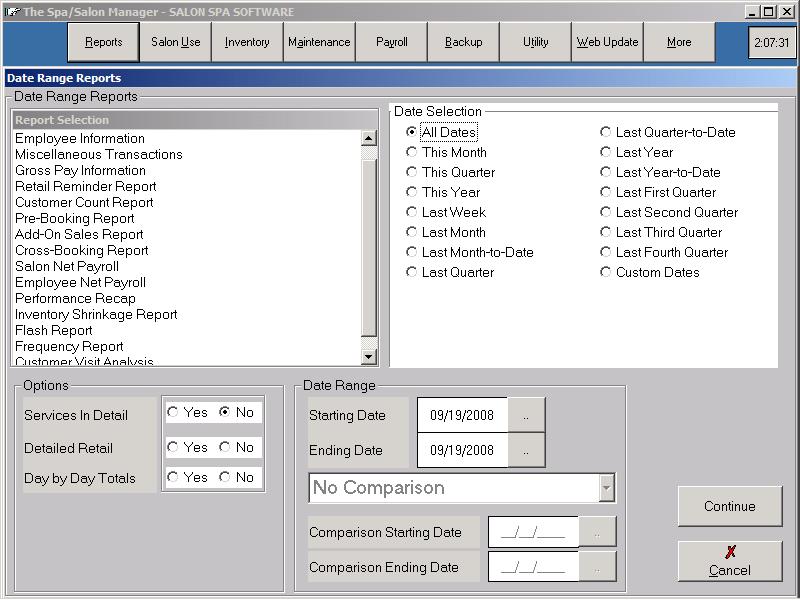
Owner Reports allow you to analyze your business. The most powerful report is the Date Range Report. The Date Range report allows you to select the date period, ie. the starting and ending date to customize the report to your needs. The report has several options that include Services in Detail, Day by Day Totals, Paid In/Out and Gross Sales. A comparison report is also available which can compare sales from this month to last or this quarter to last quarter.
| Salon Information | Total production of the business |
| Employee Information | Production separated by employee |
| Paid In/Out Information | Monies taken from the cash drawer |
| Retail Reminder Report | Shows all products purchased by customers during the selected dates along with a star in front of any products that the customer has not repurchased since the last date on the report. |
| Customer Count Report | Shows the number of new, existing, and total customers during the dates entered. |
| Pre-Booking Report | Gives a breakdown of how many appointments were pre-booked (meaning they were booked the same day that the customer had another service done) on appointments booked by the designer as well as appointments booked by anyone. If you are looking at the breakdown based on employee who booked the appointment, you will also get a customer count as well as what percentage of the customers that came into the salon were pre-booked. |
| Add-On Sales Report | Shows how many customers and how much money came in from add-on services, from walk-ins, and from services already on the book. It can be printed for dates from one day in the past up to one month in the past. |
| Cross-Booking Report | Similar to the Add-On Sales report this shows how much money came from add-on services (services not originally booked) but in this case ONLY if the services are done by a service provider that was not initially booked (as opposed to the add-on sales report which does not track which employee performs the add-on services). |
| Gross Pay Information | Breakdown by employee showing Gross Wages |
| Salon Net Payroll |
Optional Feature:
Shows total payroll responsibilities for the business |
| Employee Net Payroll |
Optional Feature:
Shows the Net (Tax) payroll information for each employee |
| Performance Recap | Shows the amount of money paid to each employee in commission and compares that amount (less expenses such as health care, etc.) to their number of hours worked to give the employee's effective hourly rate. |
| Frequency Report | This report shows a breakdown of customers purchasing retail only versus customers purchasing retail with their services as well as a breakdown of repeat service customers (customers that come in more than once during the time frame of the report) versus single visit service customers (customers than only came in once during the report's time frame). The report is broken down on a monthly basis and includes several different totals. Several of the totals may seem lower than the sum of the items being totaled - this is because customers having both service and retail visits are only counted once for the total customers and total visits to accurately portray the true number of total customers and visits. |
| Traffic Report | This report shows you how many people were checked in and checked out during each hourly period and can also be broken out by day of week |
| Customer Visit Analysis | This report, which is broken down on an employee by employee basis, shows the customer profile for each customer during the report dates for all customers with at least one visit to that employee. In addition it shows whether the customer booked a future appointment during each visit. |
Services in Detail
Services in Detail shows a breakdown of the services performed for the period selected. Each service shows the number of services performed along with the total dollar amount generated.
Day by Day Totals
The Day by Day Totals option prints the Service, Retail, Tax and Total Sales, Number of Service Customers, and the Percent of Retail to Service Percentage. A graph of the Service and Retail totals is shown.
Detailed Retail
Detailed Retail allows retail information to be listed by one of the following criteria, by Code Number, by Category, by Classification, by Supplier, or by Department. The report shows the number of items sold and the total dollar amount generated. When listing by Code Number you can also choose to group your list by Category, Classification, or Supplier. You can optionally have the program show the On Hand and Minimum amounts on the report. Finally, you can select the option for the Turn Rate Report. This report will show you how many of each item was sold, along with the average amount on hand for that item during the dates of the report. It then gives you a Monthly Turn Rate which represents how much of that average on hand amount was turned over per month. For example, if you sold 20 items during a two month period and averaged 5 of those items on hand your turn rate would be 2 - you sold twice the amount that you averaged having in stock per month meaning that you needed to restock twice per month.
Comparison Reports
The Comparison Report is only valid for sales information. You can NOT do a comparison report for Day by Day Totals or Detailed Retail. The report shows the Service total with the comparison to the desired period along with retail, customer count and total sales.